Inside the Suite
Each indicator handles one job — trend, momentum, structure, or execution. Together they form a complete decision framework for traders. Here's how each piece works and how they fit together.
Learn The Full Strategy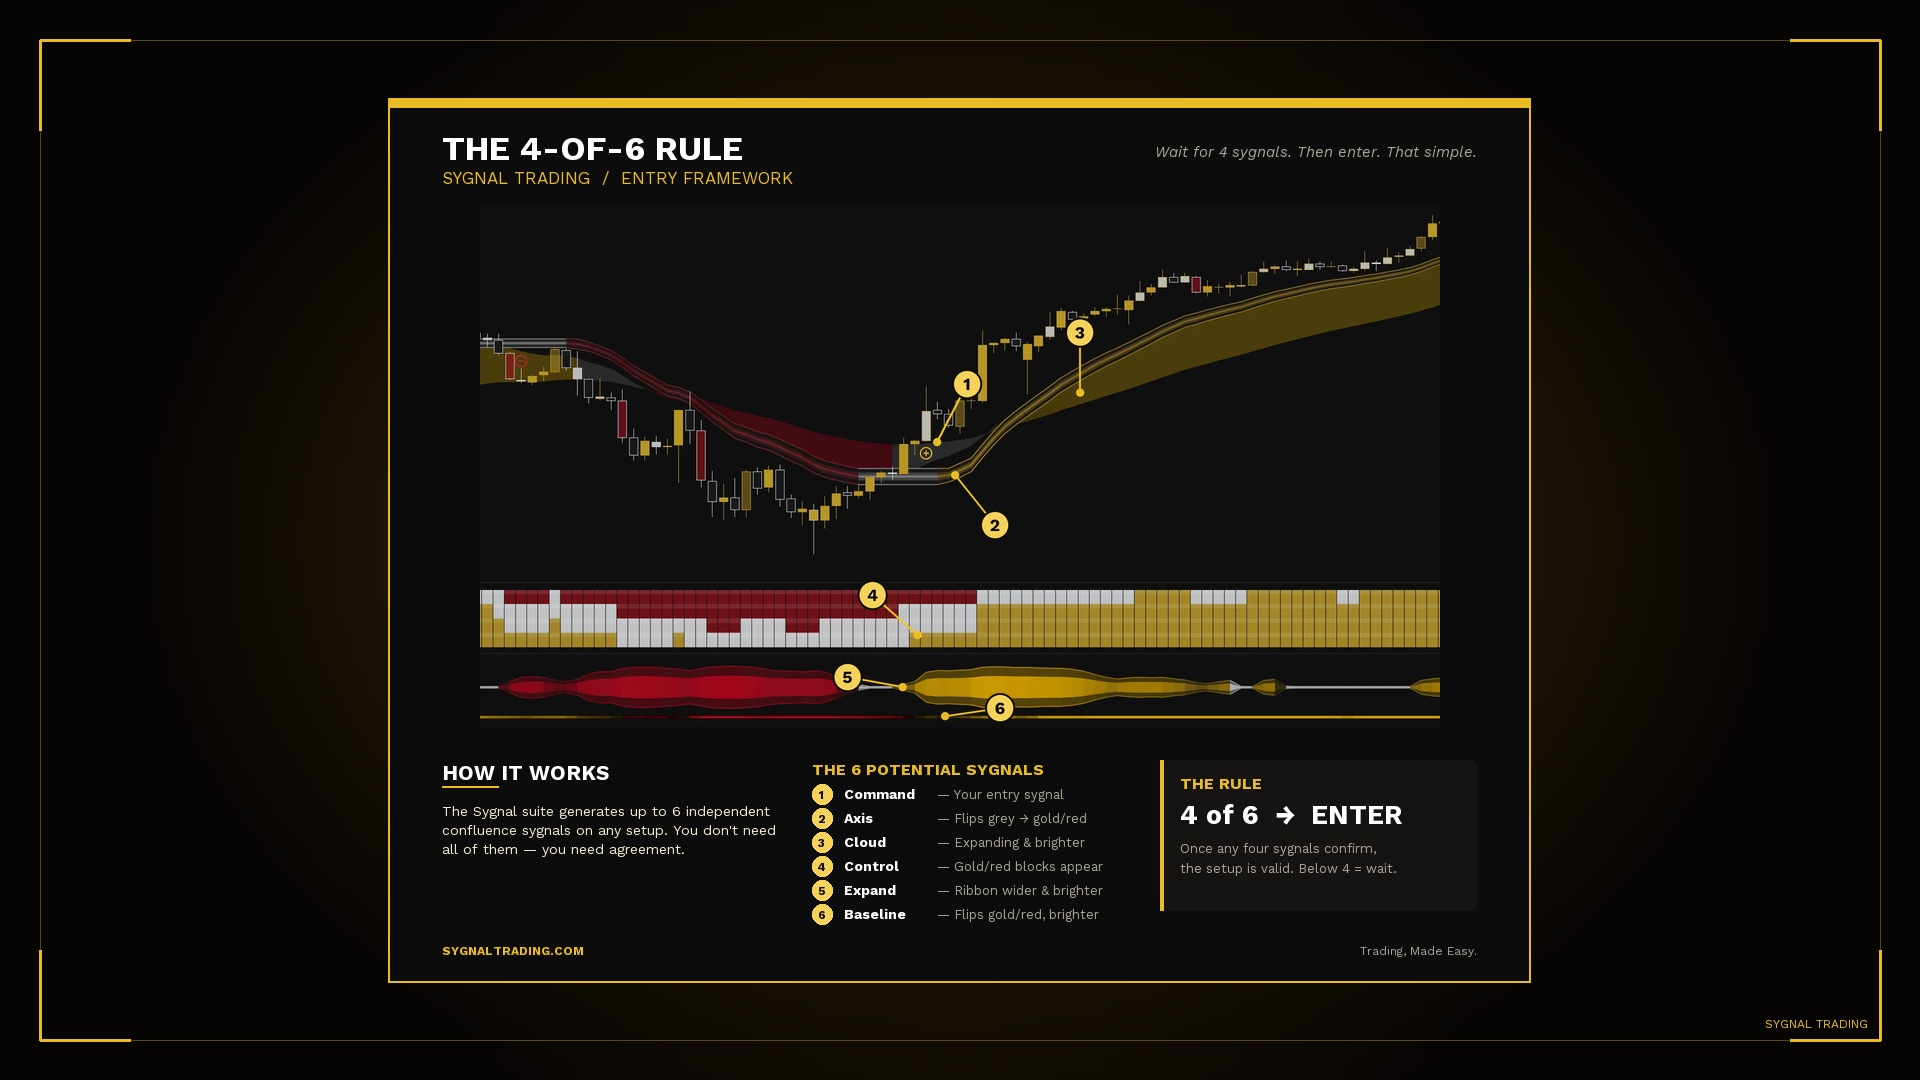
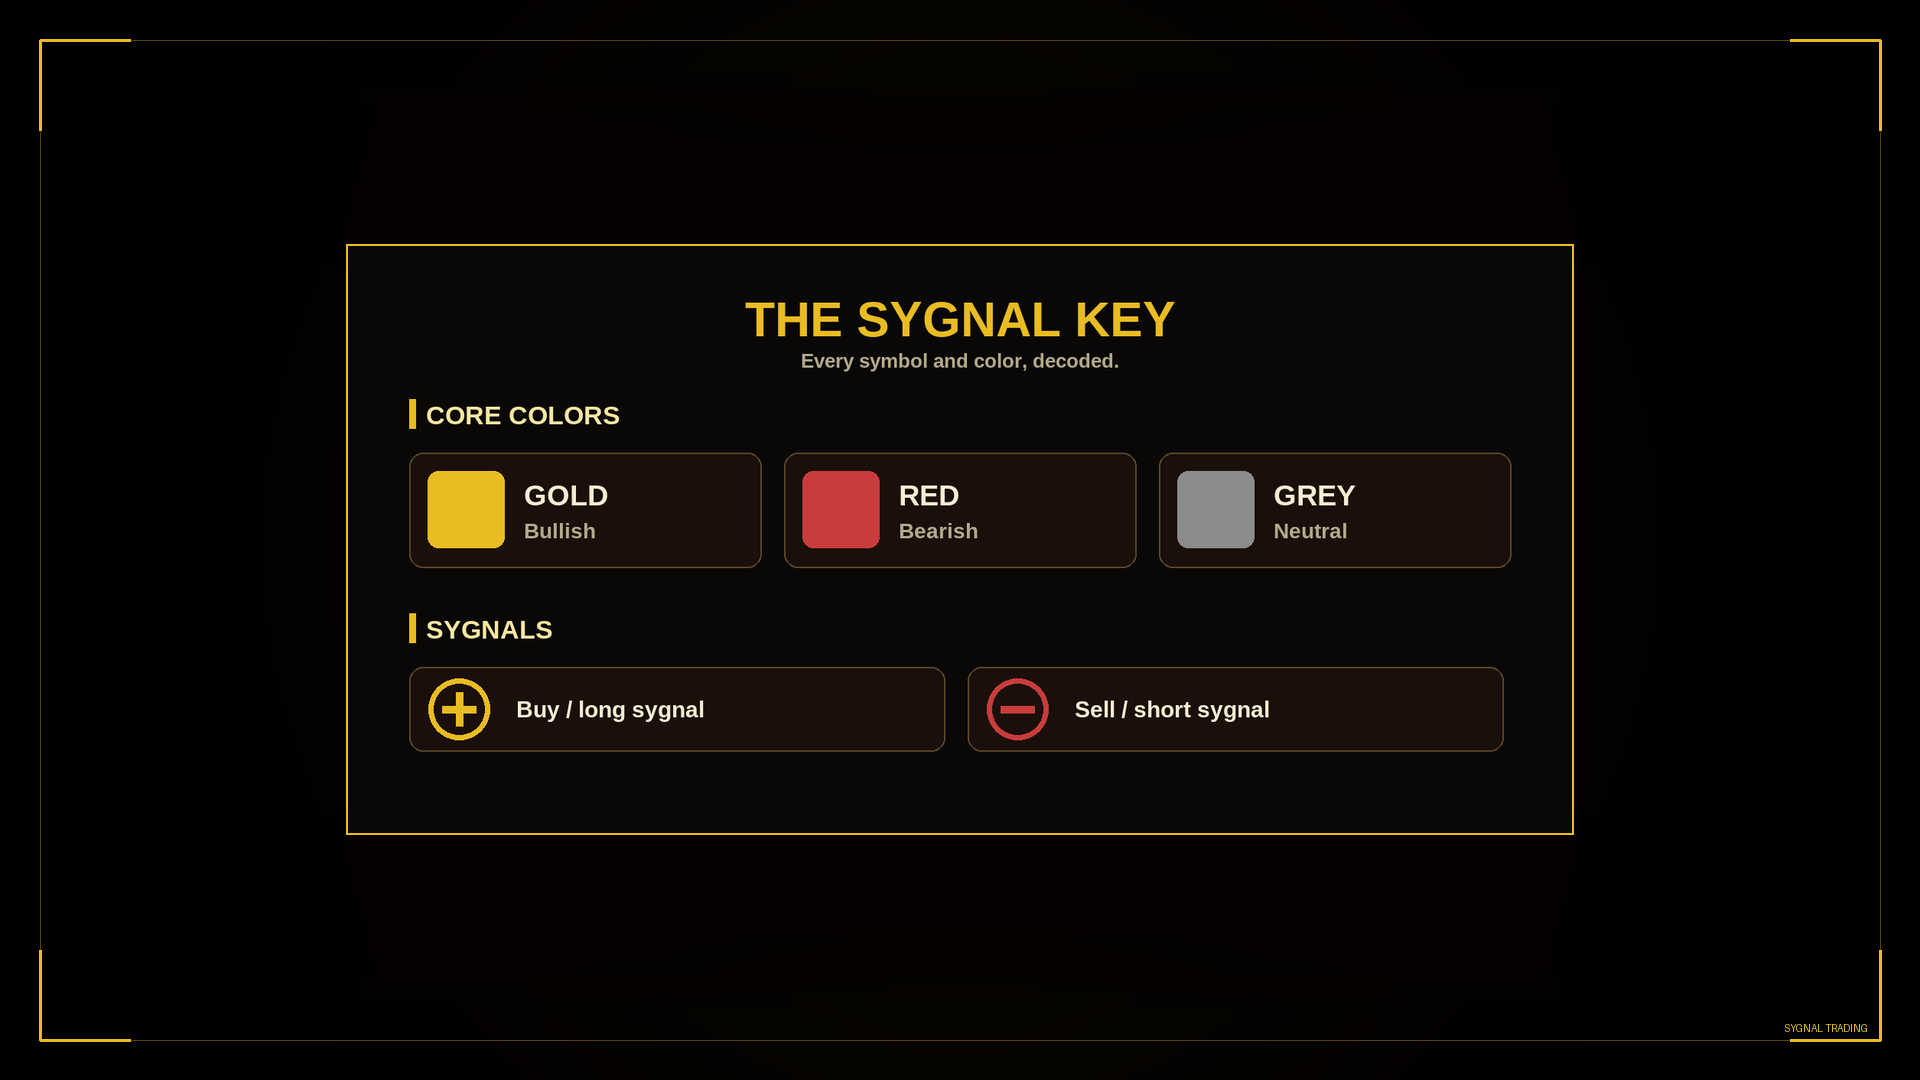
The SYGNAL Key
Every symbol and color, explained in one place.A single reference for the entire suite — what each shape, mark, and color means on your chart, so you can read a SYGNAL setup at a glance.
SYGNAL Command
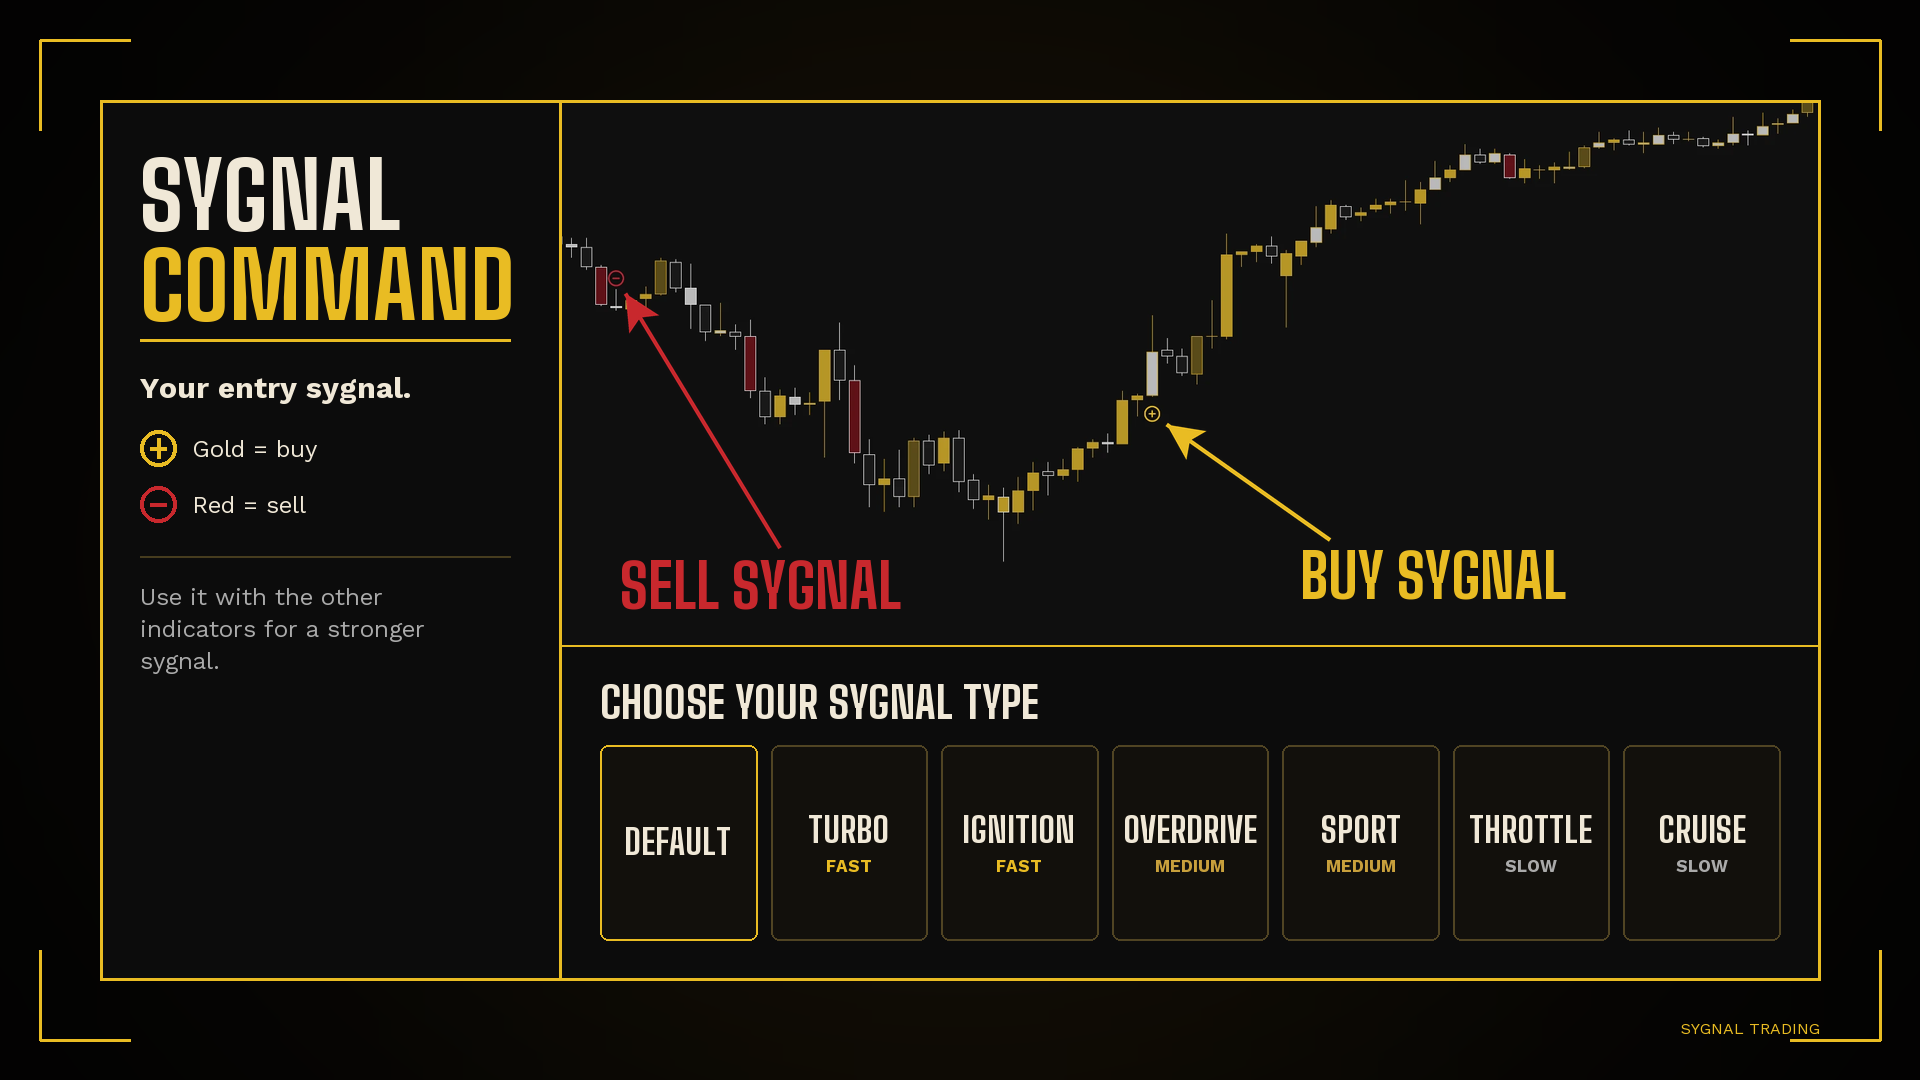
On-chart execution sygnals.Command is the execution layer of the suite. It plots clear buy and sell sygnals, entry zones, invalidation markers, stop-loss levels, and pre-mapped take-profit targets directly on your chart so you can act without second-guessing the setup.
How to use it: Use it as your primary trigger once Axis, Control and/or Expand confirm direction.
SYGNAL Axis
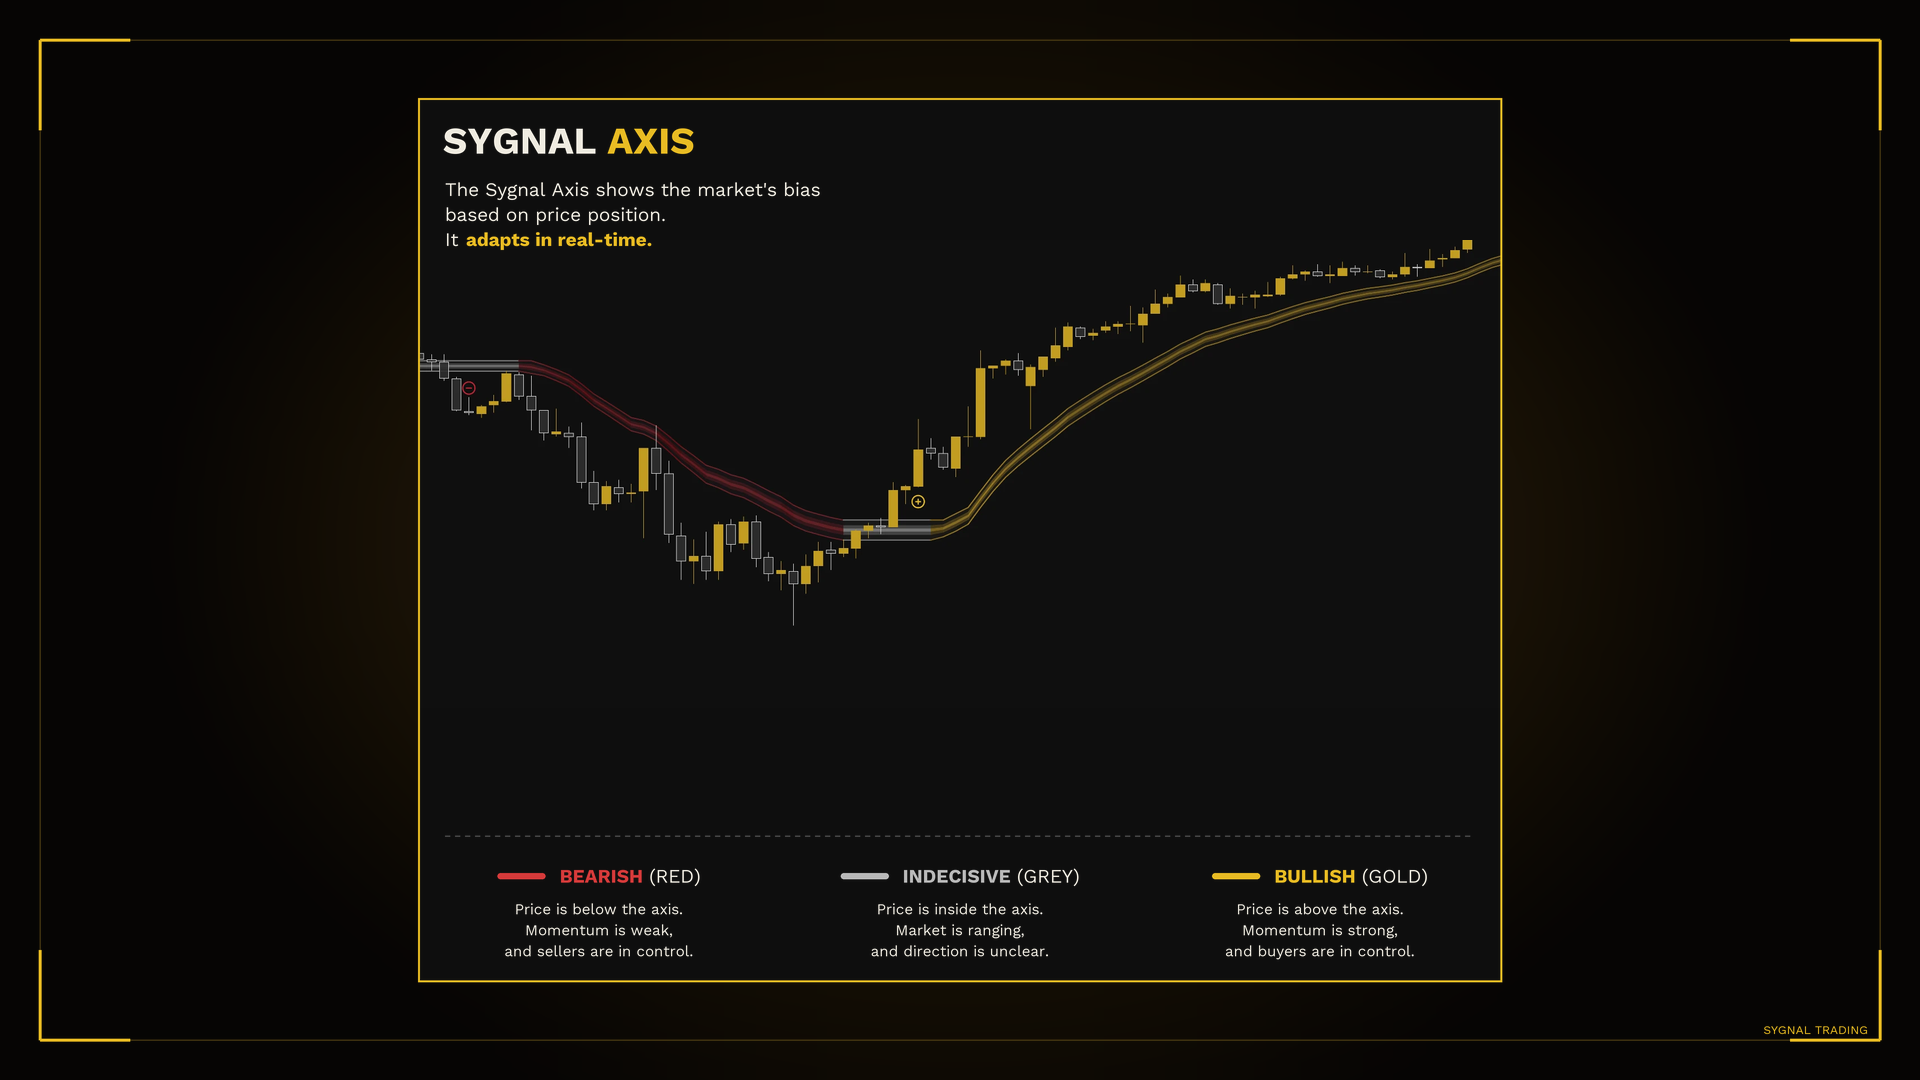
Market state at a glance.Axis color-codes pressure on the chart: gold for bullish control, maroon for bearish control, and grey for neutral chop. It is designed to keep you out of low-quality conditions and aggressive in the right ones.
How to use it: Only take Command sygnals that align with the current Axis color.
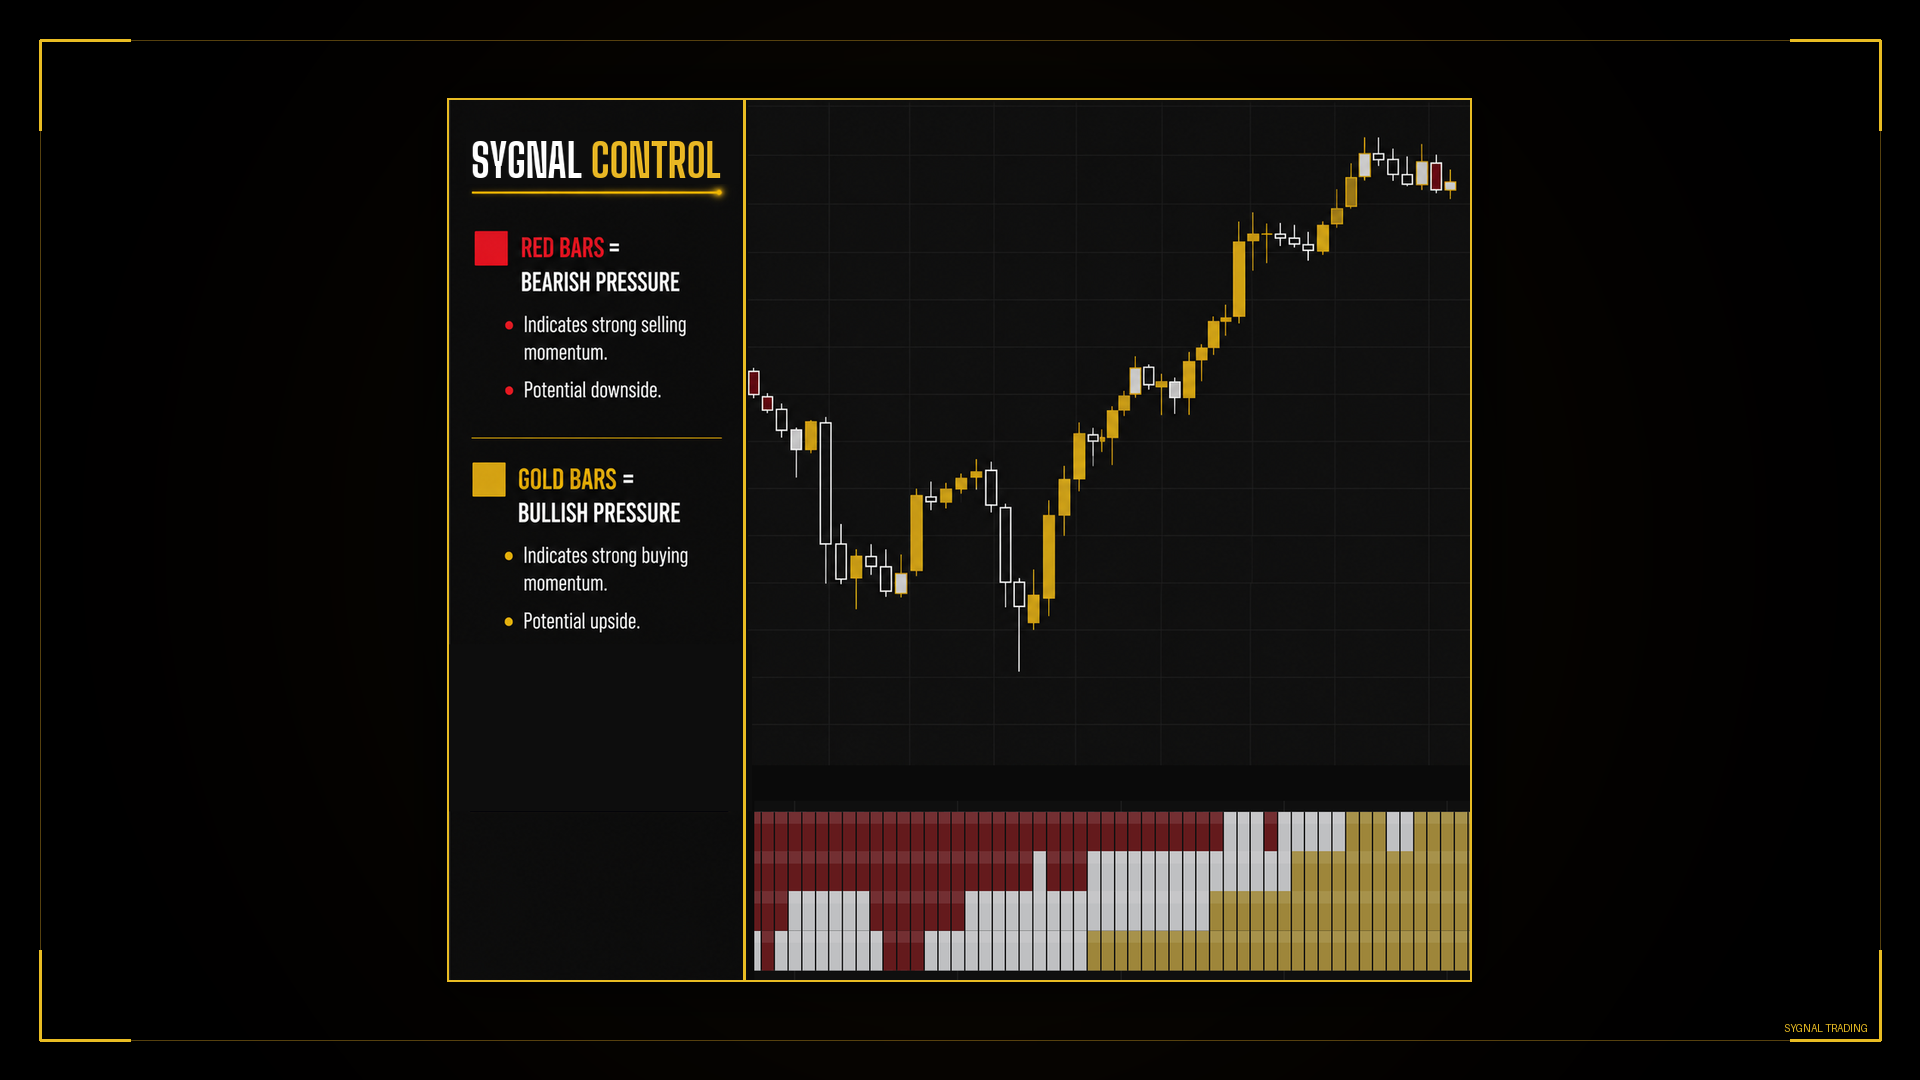
SYGNAL Control
Bar-by-bar pressure read.Control color-codes every bar by underlying pressure — gold for bullish momentum, red for bearish momentum, and white for neutral. It gives you an instant read on who's in control so you can stack confluence before pulling the trigger.
How to use it: Wait for at least 2 matching bars before entering a trade. Pair with Command setups (⊕ bullish, ⊗ bearish) for clean entries.
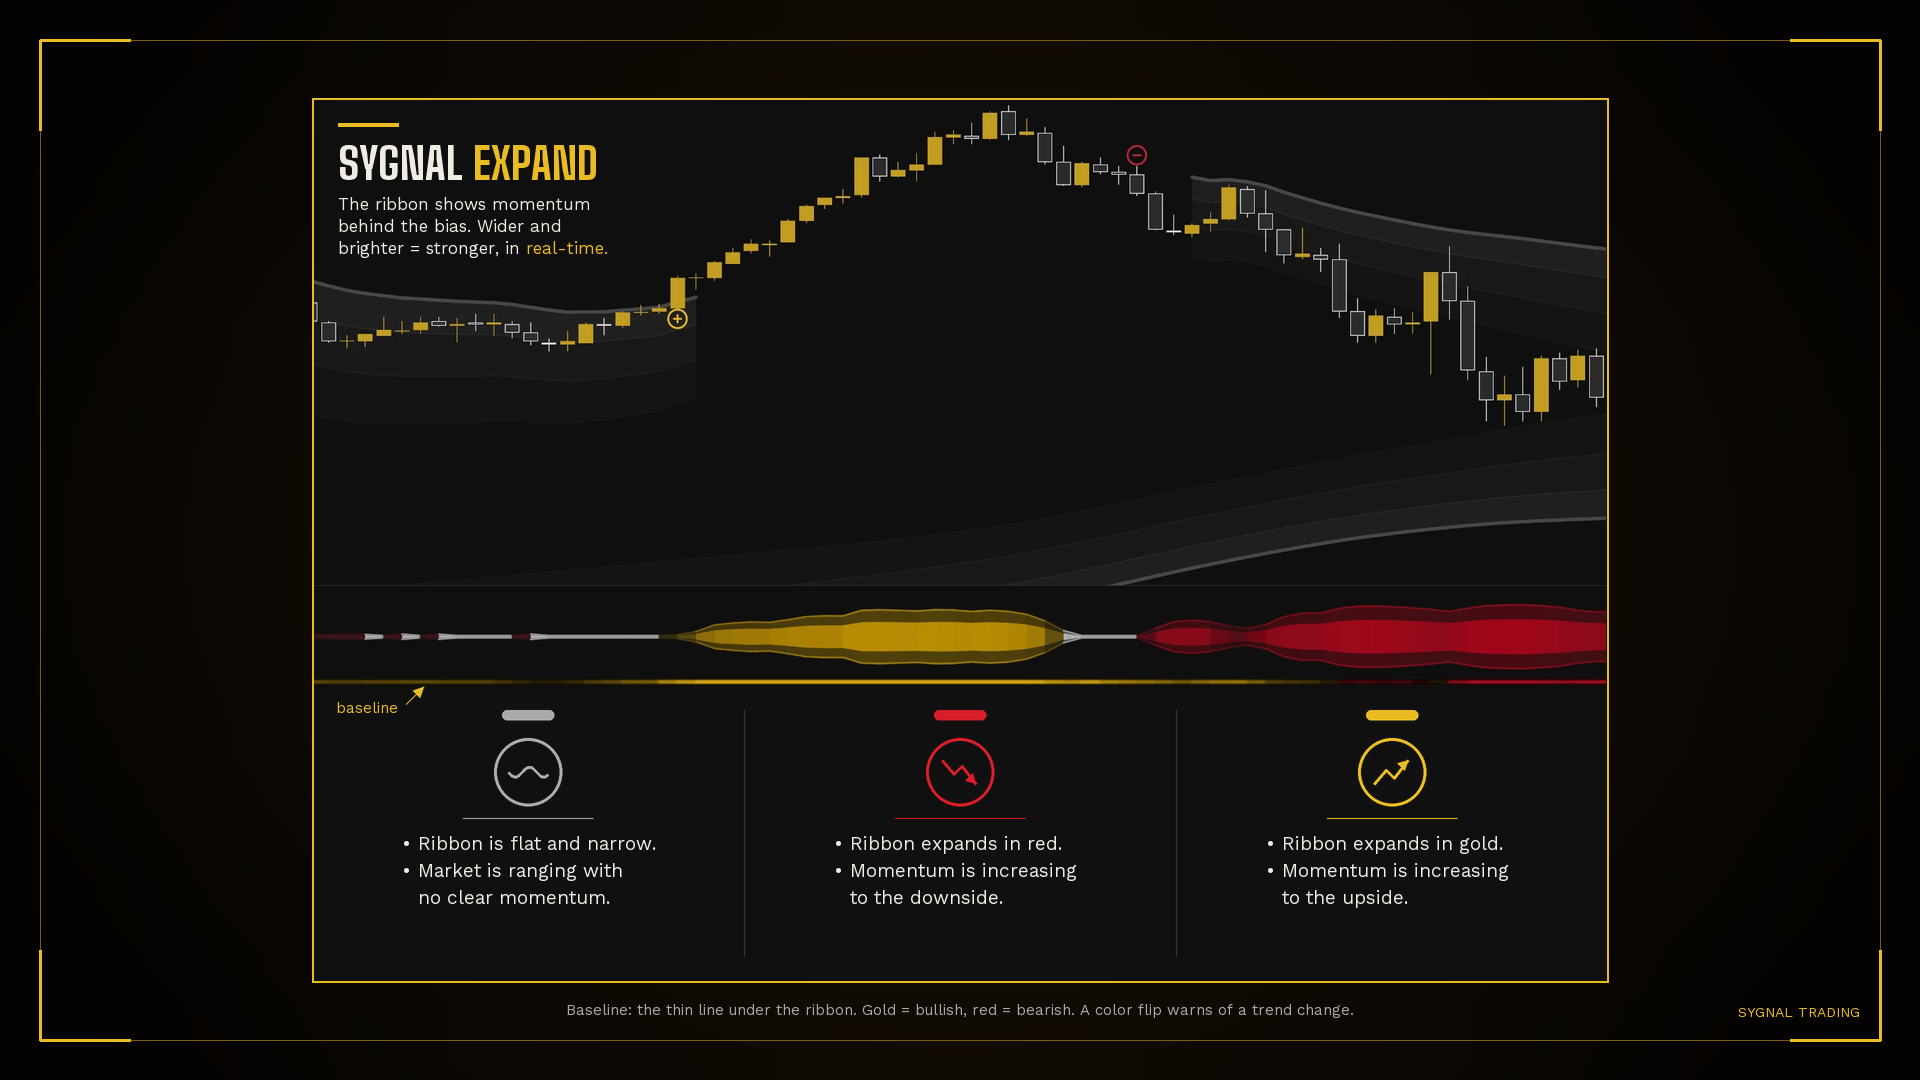
SYGNAL Expand
Momentum expansion gauge.Expand visualizes momentum expansion behind the current bias in real-time. A flat, narrow ribbon means the market is chopping with no clear direction. Expansion in red sygnals sellers taking control; expansion in gold sygnals buyers driving the move.
How to use it: Use Expand to confirm momentum before entries. Avoid trading when the ribbon stays flat and narrow.
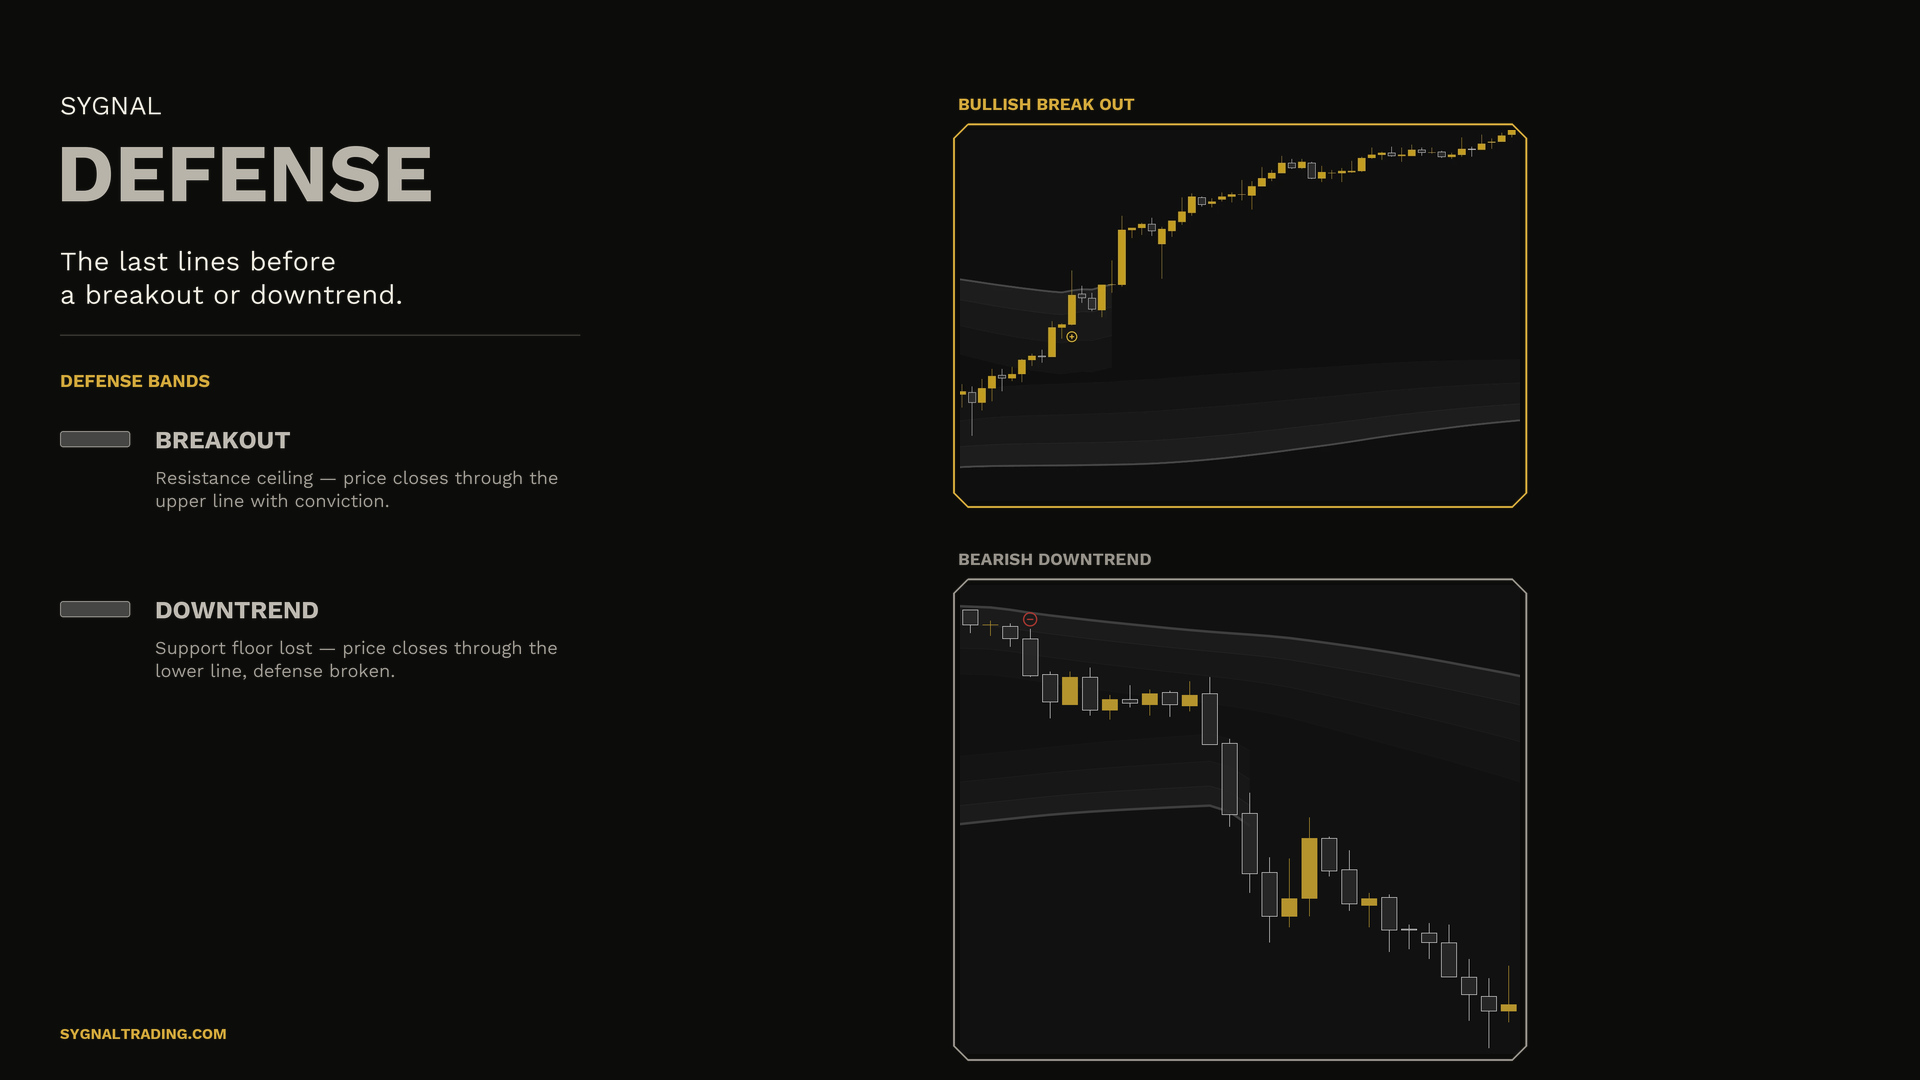
SYGNAL Defense
The last lines before a breakout.Defense draws adaptive support and resistance bands that act as the market's last lines of defense. When price compresses inside the bands the trend is intact; a clean close beyond either line marks the moment a breakout or breakdown is confirmed.
How to use it: Watch for clean closes outside the bands as breakout/breakdown triggers. Pair with Command for entries in the direction of the break.
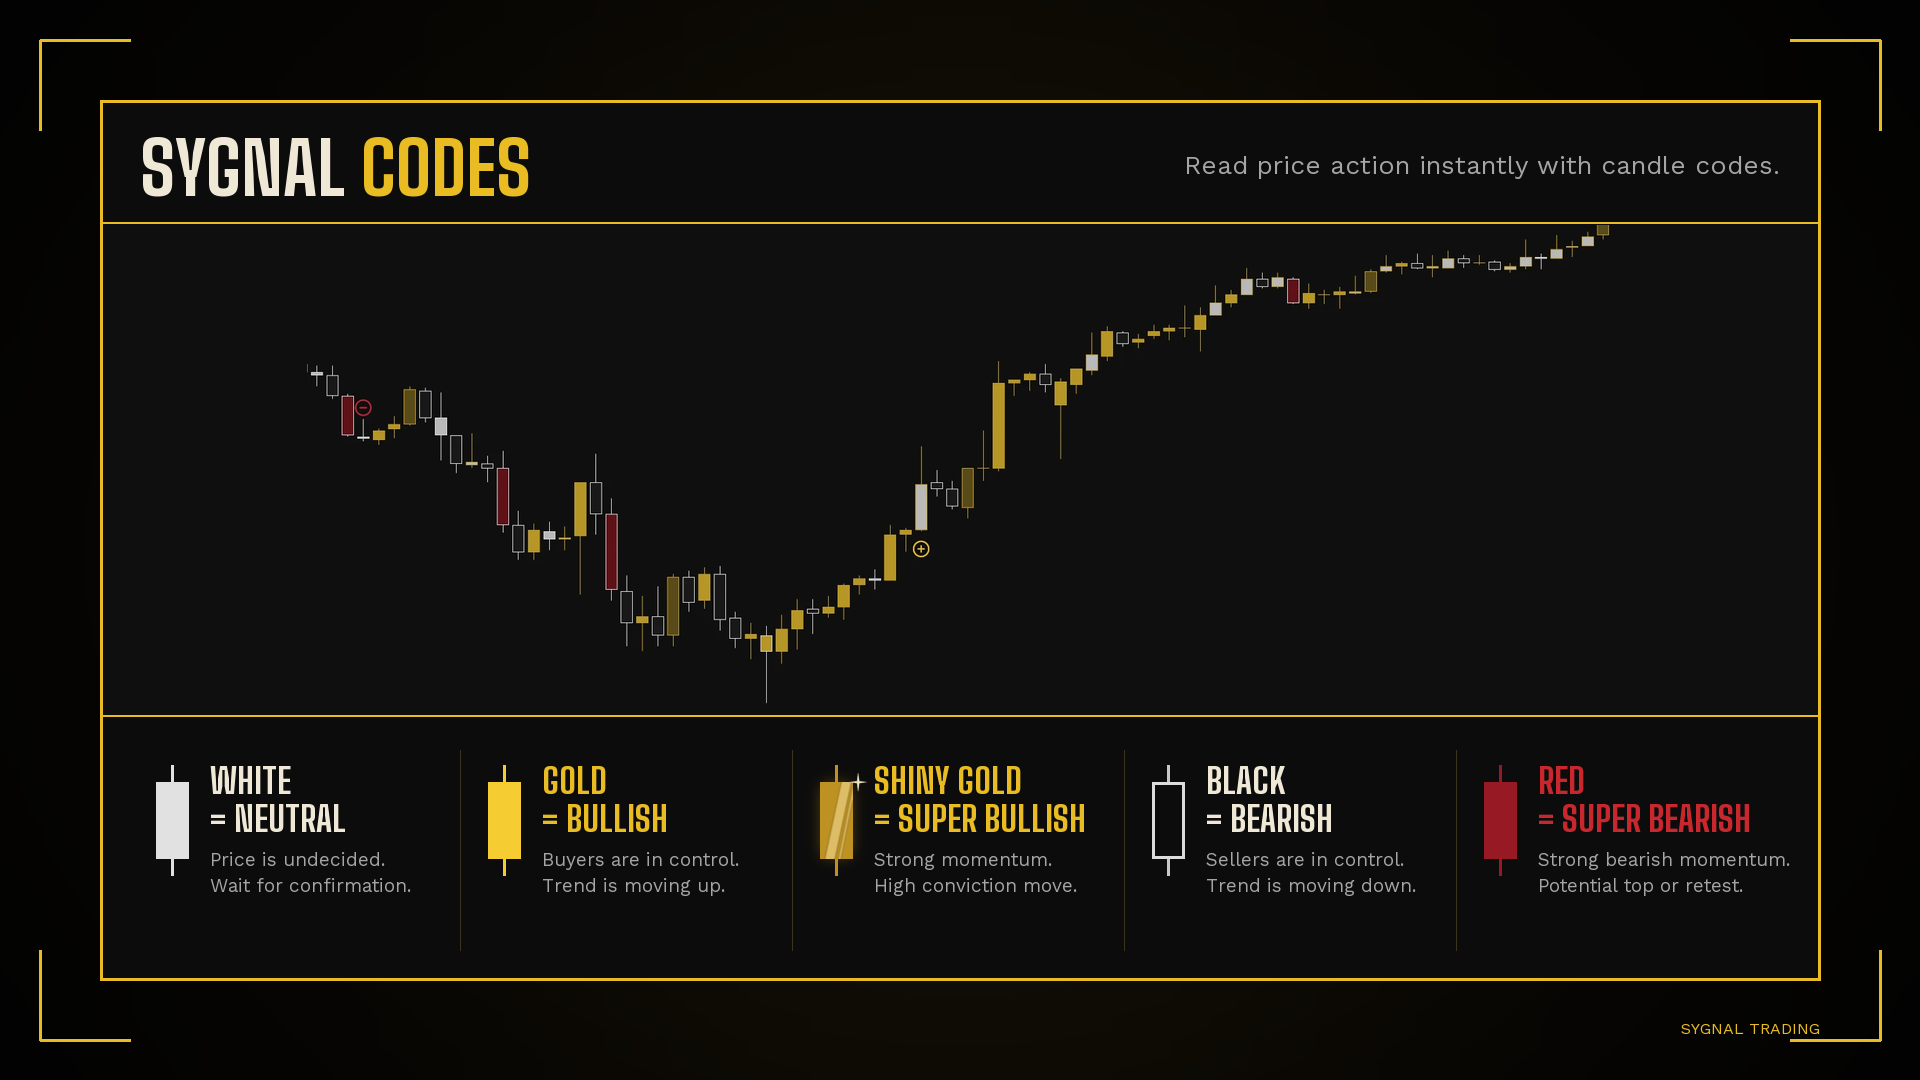
SYGNAL Codes
Candle classification engine.Codes scans every candle and tags it by character — bullish, bearish, exhaustion, or high-conviction momentum. This makes it easy to spot reversals, continuations, and trap candles before the next bar opens.
How to use it: Use exhaustion tags at extremes and momentum tags at breakouts for confirmation.
SYGNAL Levels
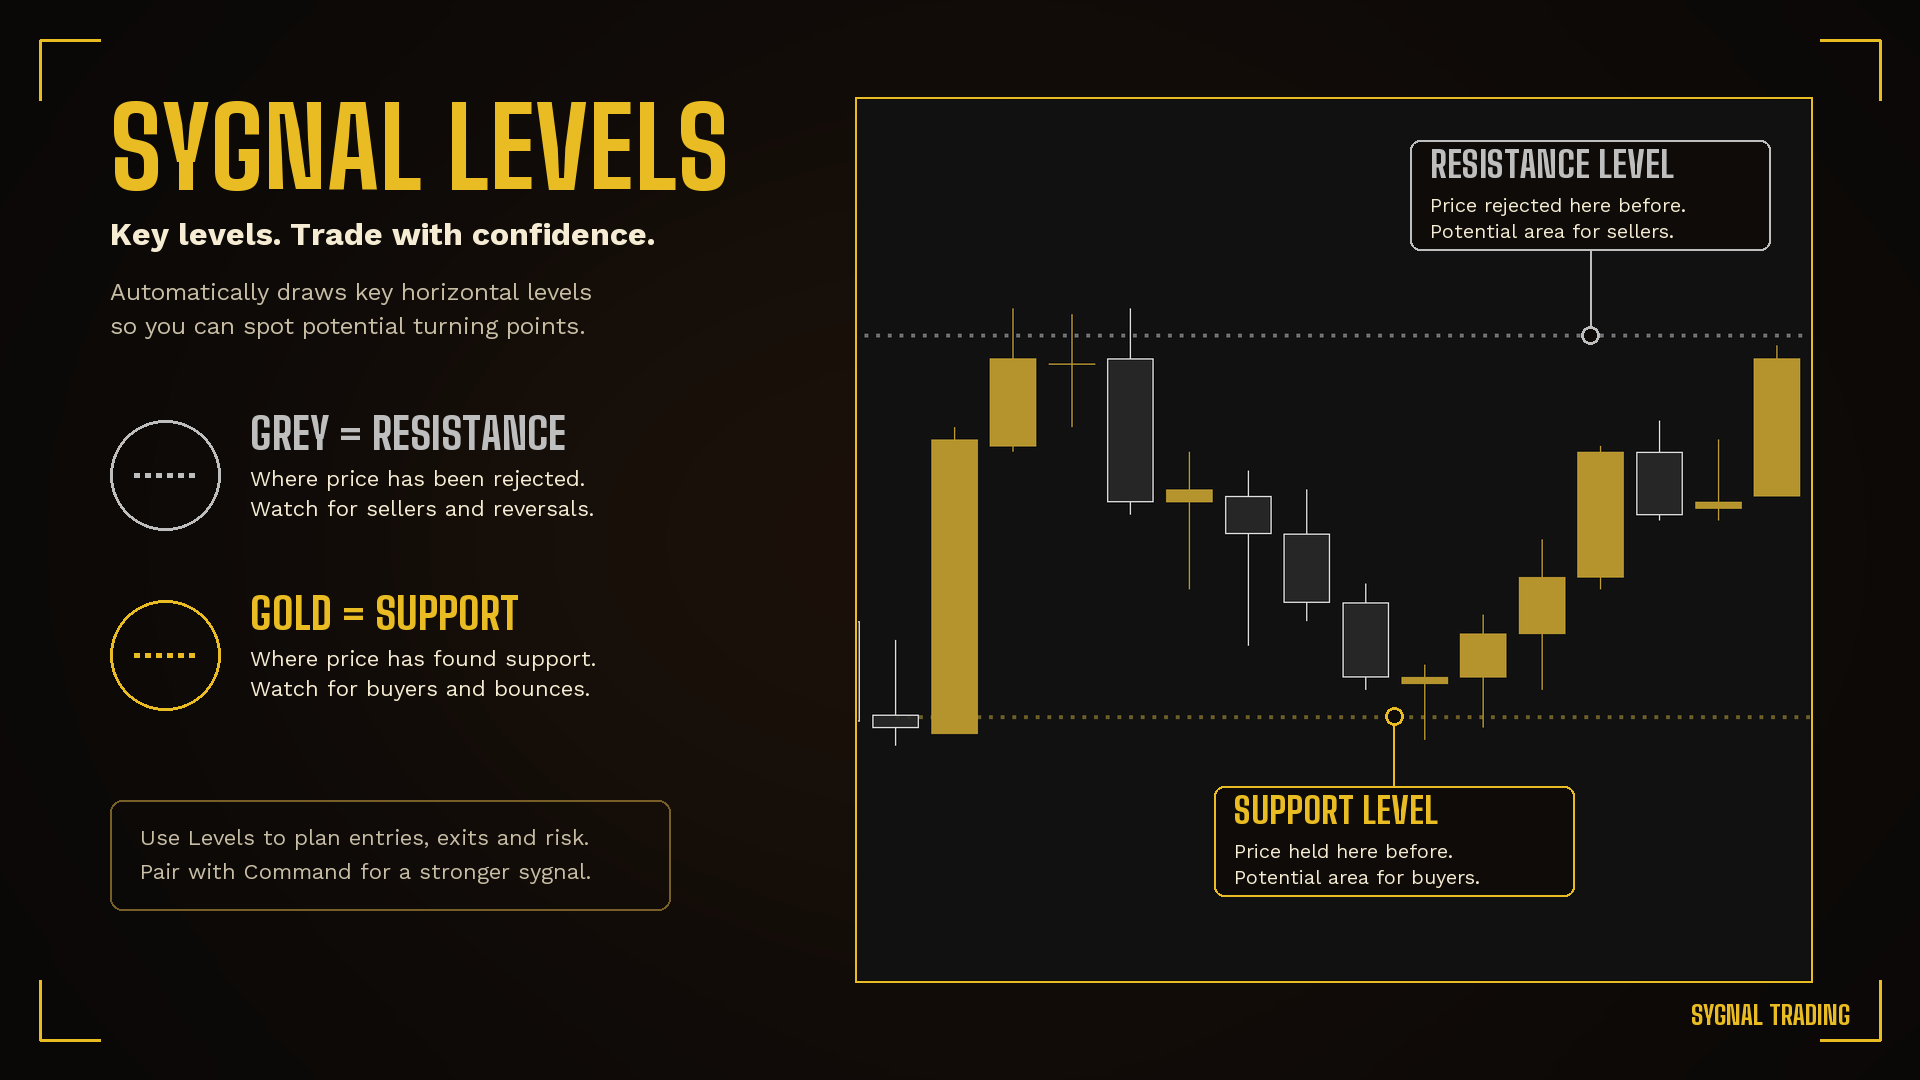
Automatic support & resistance.Levels auto-plots the most reactive support and resistance across multiple timeframes so you always know where the market is likely to pause, reject, or break.
How to use it: Plan entries and targets around Levels. Treat clean breaks as continuation triggers.
SYGNAL Cloud
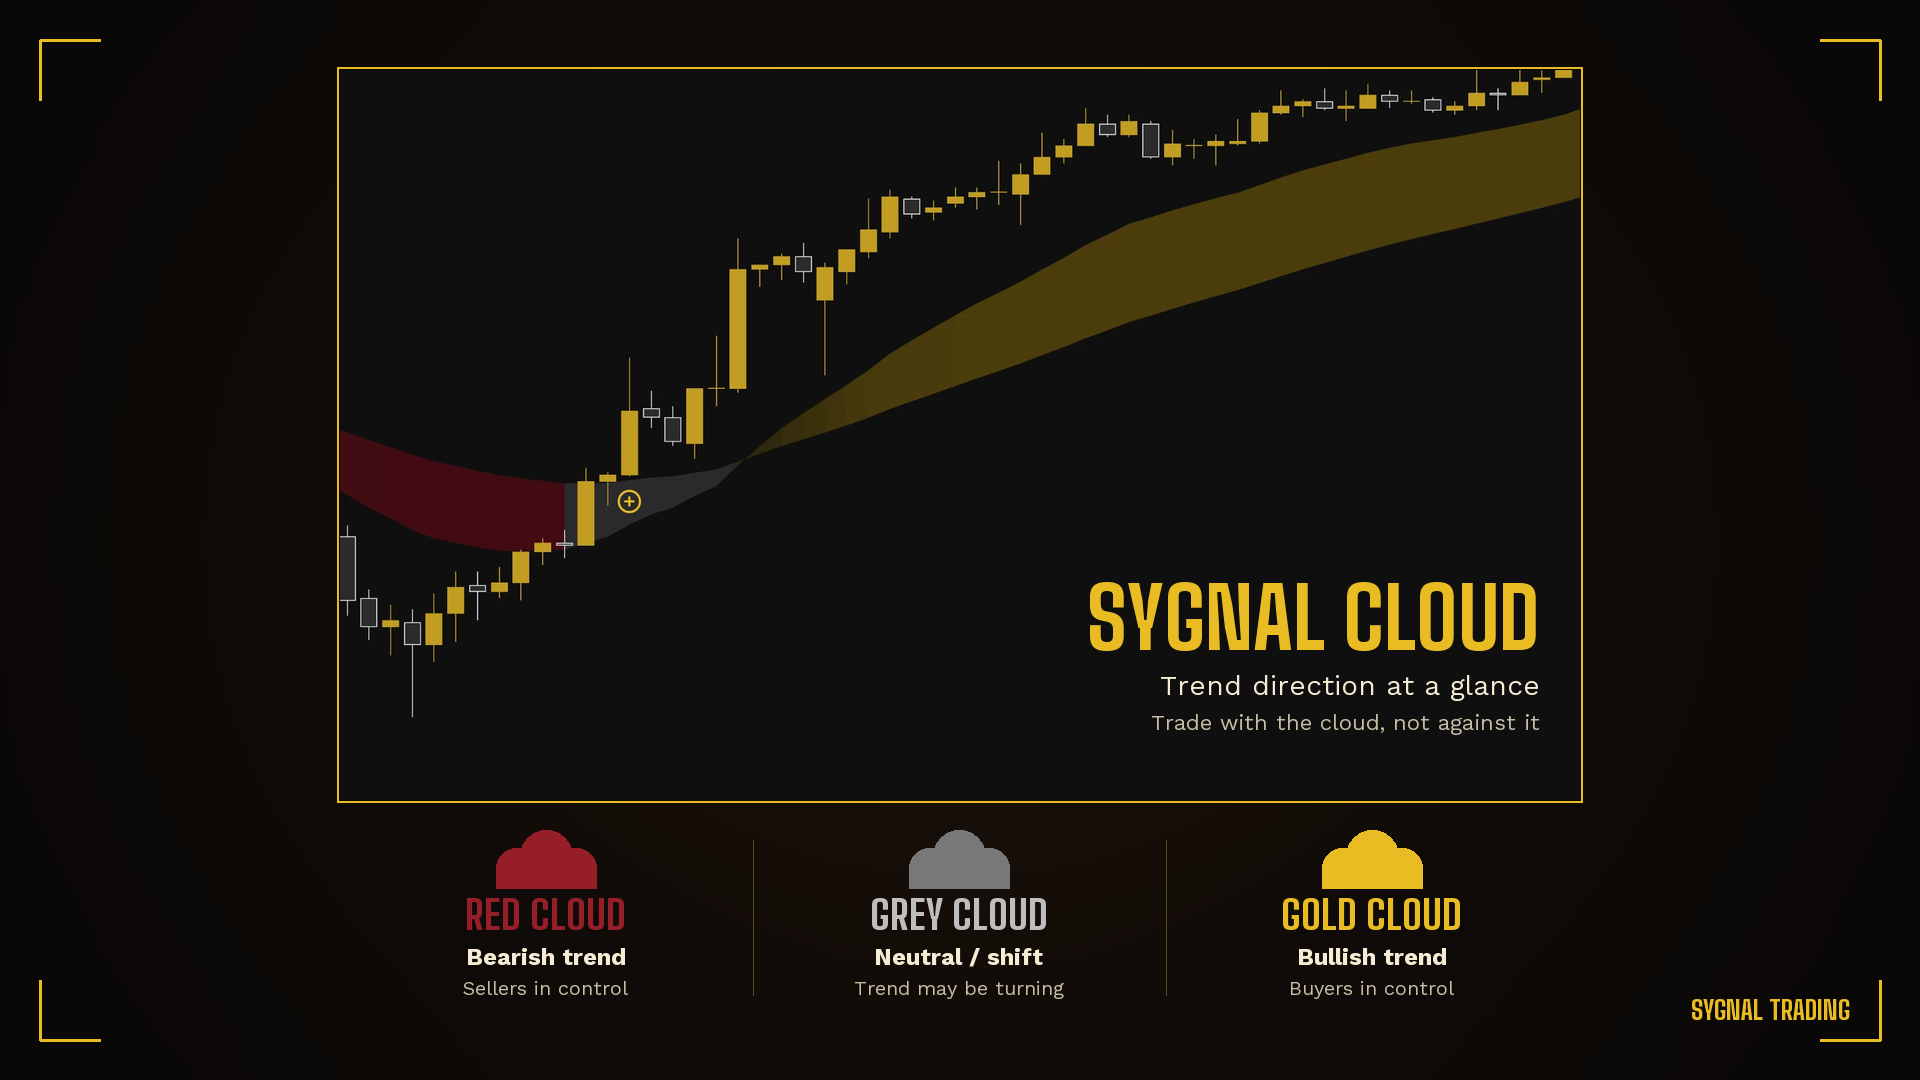
Trend direction at a glance.Cloud shades the trend behind price — gold when buyers are in control, red when sellers are in control, and grey when the trend may be turning.
How to use it: Trade with the cloud, not against it. Take gold sygnals above a gold cloud and red sygnals under a red cloud.
Ready to use the SYGNAL Suite?
Get invite-only TradingView access plus setup guides and live trade education in the private Discord.